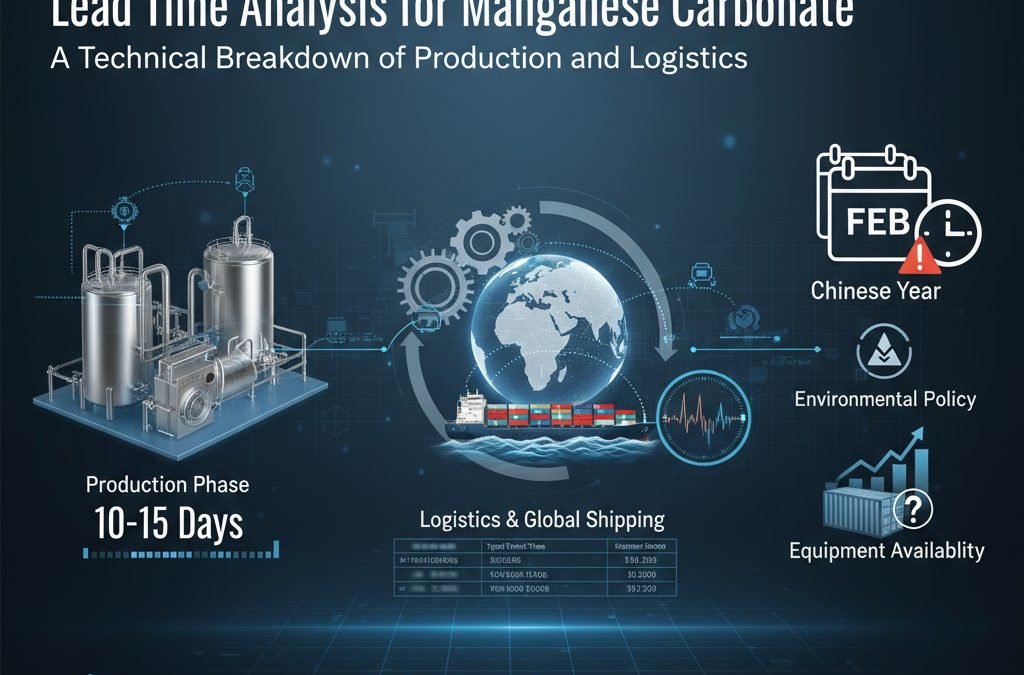
Total Estimated Lead Time: 35–65 days for intercontinental shipments (China to US/EU).
Production Phase: Typically 10–15 days, heavily dependent on grade specifications (Industrial vs. Battery Grade) and drying processes.
Logistics Phase: Represents 60-70% of the total lead time; ocean freight volatility is the primary variable.
Critical Bottlenecks: Chinese New Year (February), Environmental Compliance Inspections, and Port Congestion.
1. Introduction
In the global supply chain for inorganic chemicals, specifically Manganese Carbonate , accurate lead time forecasting is essential for inventory management. Procurement managers in the ferrite, agriculture, and battery material sectors often face challenges due to the discrepancy between “promised” delivery dates and actual arrival dates.
This article provides a technical, data-driven analysis of the typical lead times associated with sourcing Manganese Carbonate from China. It dissects the timeline into three operational phases: Manufacturing, Export Compliance, and Global Logistics. The objective is to provide buyers with a realistic framework for planning procurement cycles and calculating safety stock levels.
2. Phase I: The Manufacturing Cycle (10–15 Days)
The “Ex-Factory” lead time is defined as the duration from the receipt of the deposit (or Letter of Credit activation) to the completion of packaging. For Manganese Carbonate, this is not merely a logistical step but a chemical engineering process.
2.1 Raw Material Procurement (Days 1–3)
The production of Manganese Carbonate relies on Rhodochrosite or Pyrolusite ore.
Process: Raw ore must be transported from mines to the chemical plant. While major factories maintain ore stockpiles, specific low-impurity requirements (e.g., low Calcium or Magnesium) may require sourcing specific ore batches.
Time Factor: If standard ore is in stock, this step is instantaneous. If specific sourcing is required, it adds 2–3 days.
2.2 Chemical Synthesis and Reaction (Days 4–8)
The core manufacturing involves the reaction of Manganese Sulfate ($MnSO_4$) with a carbonate source (usually Ammonium Bicarbonate $NH_4HCO_3$ or Sodium Carbonate $Na_2CO_3$).
Leaching and Purification: The ore is leached with sulfuric acid. The solution then undergoes deep purification to remove heavy metals (Pb, Cd, As). This purification step is critical for Battery Grade material and takes approximately 24–36 hours.
Precipitation: The reaction occurs in reactor tanks at controlled temperatures (typically 50°C–60°C).
Washing: The precipitate must be washed repeatedly with deionized water to remove soluble sulfates. Insufficient washing leads to high impurity levels, requiring reprocessing.
2.3 The Drying Bottleneck (Days 9–11)
Drying is often the rate-limiting step in Manganese Carbonate production.
Technical Requirement: Manganese Carbonate is heat-sensitive. It creates Manganese Oxide if overheated. Therefore, “Flash Drying” or low-temperature airflow drying is used.
Moisture Control: The target moisture content is usually $\le 2.0\%$.
Capacity Limits: A standard production line might output 20–30 metric tons per day. For orders exceeding 100MT (4-5 containers), the drying phase will strictly dictate the schedule.
2.4 Quality Assurance (QA) Testing (Days 12–13)
Before packaging, samples are sent to the laboratory.
Standard Tests:
Mn Content: Titration method to ensure $\ge 44\%$.
Impurities: ICP-OES (Inductively Coupled Plasma Optical Emission Spectroscopy) is used to detect trace heavy metals.
Duration: A full analysis takes 24 hours. If the batch fails (e.g., high sulfate content), re-washing and re-drying are required, adding 48 hours.
2.5 Packaging (Days 14–15)
Standard: 25kg PP/PE bags.
Customization: Palletization (shrink-wrapped) or Jumbo Bags (1000kg/1100kg). Palletization adds approximately 1 day to the process for labor and curing of the wrap.
3. Phase II: Export Compliance & Inland Logistics (5–7 Days)
Once production is complete, the cargo moves from the factory floor to the “Ship’s Rail.” This phase involves strict regulatory compliance in China.
3.1 Inland Transportation
Distance: Most manganese manufacturers are located in inland provinces (e.g., Guangxi, Hunan, Guizhou) near mining resources.
Transit: Trucking to main ports (Guangzhou, Shenzhen, Ningbo, or Shanghai) typically covers 500km–1000km.
Timeframe: 1–2 days.
3.2 Customs Declaration (Export)
Manganese Carbonate (HS Code: 2836.99) is generally considered non-hazardous for transport, but regulations can change.
Documentation: Commercial Invoice, Packing List, and Chemical Safety Data Sheet (MSDS).
Customs Inspection: China Customs performs random inspections. A physical inspection of the container can delay shipment by 3–5 days. Under normal circumstances, “Release” is granted within 24 hours of declaration.
3.3 Port Handling
Cut-off Dates: Containers must enter the port terminal (Gate-in) typically 2–3 days before the vessel’s Estimated Time of Departure (ETD). Missing this window (SI Cut-off) results in the cargo being “rolled” to the next week’s vessel.
4. Phase III: Ocean Freight Transit Times (Variable)
The ocean freight sector operates on Scheduled Transit Time vs. Actual Transit Time. Data from maritime analytics firms indicate that reliability fluctuates based on global congestion.
The following table outlines the Port-to-Port transit times from major Chinese base ports (Shanghai/Ningbo/Shenzhen).
4.1 Transit Time Reference Table
| Destination Region | Major Ports | Typical Transit Time (Days) | Reliability Note |
| North America (West) | Los Angeles, Long Beach, Vancouver | 16 – 22 | Moderate congestion risks at destination. |
| North America (East) | New York, Savannah, Charleston | 32 – 40 | Affected by Panama Canal restrictions. |
| Europe (North) | Rotterdam, Hamburg, Antwerp | 30 – 45 | Dependent on Red Sea/Suez route status. |
| Mediterranean | Genoa, Valencia, Fos | 28 – 35 | Direct services are faster; transshipment adds time. |
| South America (East) | Santos, Buenos Aires | 35 – 45 | Often involves transshipment in Singapore or Europe. |
| Southeast Asia | Ho Chi Minh, Bangkok, Jakarta | 4 – 10 | High frequency, high reliability. |
| Middle East | Jebel Ali, Dammam | 20 – 28 | Generally stable. |
Data Source: Transit times are estimates based on average carrier schedules (e.g., Maersk, MSC, COSCO). For real-time data, buyers are encouraged to consult indexes such as the Freightos Baltic Index (FBX) or the Drewry World Container Index.
Reference: Drewry Maritime Research
4.2 Transshipment vs. Direct Service
Direct Service: Point A to Point B. Higher cost, shortest time.
Transshipment: The container is offloaded at a hub (e.g., Singapore, Busan) and re-loaded onto another vessel.
Impact: Transshipment adds 7–10 days to the lead time and increases the risk of damage or loss. Buyers should explicitly clarify with suppliers if the quoted lead time is based on direct or transshipment vessels.
5. External Variables Impacting Lead Time
Beyond the standard workflow, statistical analysis of historical data reveals three major factors that cause deviation from the schedule.
5.1 Seasonality: The Chinese New Year (CNY)
This is the single largest disruptor in the Chinese supply chain.
Timeline: Usually late January or early February (Lunar Calendar).
Operational Reality: While the official holiday is 7 days, the industrial shutdown lasts 3–4 weeks. Logistics drivers and factory workers return to their hometowns.
Pre-CNY Rush: In the 3 weeks prior to CNY, port congestion peaks as exporters rush to ship goods.
Post-CNY Recovery: It takes approximately 14 days after the holiday for production capacity to return to 100%.
5.2 Environmental Policy & Energy Control
China’s “Dual Control” policy on energy consumption and environmental protection inspections can lead to unannounced power rationing or temporary factory shutdowns.
Impact: These events are sporadic but can pause production for 3–10 days.
Mitigation: Factories with higher environmental compliance ratings (ISO 14001) are less likely to be affected than smaller, non-compliant workshops.
5.3 Equipment Availability
For Manganese Carbonate, which is a heavy cargo, 20GP (General Purpose) containers are required. During trade imbalances, there may be a shortage of empty 20GP containers at inland depots, delaying the “Pick-up” phase by 3–7 days.
6. Calculating the Total Lead Time (Formula)
To assist procurement departments in ERP planning (Enterprise Resource Planning), the following formula is recommended for calculating the “Dock-to-Dock” lead time:
Total Lead Time = T(Production) + T(Inland) + T(Customs) + T(Ocean) + T(Destination)
T(Production): 14 Days (Standard Buffer)
T(Inland): 3 Days (Transport to Port)
T(Customs): 3 Days (Export Clearance)
T(Ocean): Variable (e.g., 35 Days for EU)
T(Destination): 3 Days (Estimated Import Clearance)
Example Calculation (China to Rotterdam): 14 + 3 + 3 + 35 + 3 = 58 Days
Recommendation: Procurement managers should set the ERP “Expected Lead Time” to 60 Days for European orders to account for minor variances.
7. Recommendations for Procurement Strategy
Based on the analysis of the supply chain mechanics, the following strategies are recommended to optimize stability.
7.1 Implement Rolling Forecasts
Spot purchasing (ordering only when stock is low) exposes buyers to maximum lead time volatility.
Strategy: Share a 3-month non-binding rolling forecast with the manufacturer.
Benefit: This allows the manufacturer to reserve raw materials (Manganese Ore) and allocate production slots in advance, potentially reducing the production time from 14 days to 5 days.
7.2 Standardization of Specifications
Customized specifications (e.g., non-standard particle size or specific bulk density) require machine recalibration.
Strategy: Adhere to standard industry grades (e.g., HG/T 2836-2011 standard for Industrial Grade) where possible.
Benefit: Standard grade material is often kept in “Safety Stock,” allowing for immediate shipment.
7.3 Incoterms Selection
The choice of Incoterms (International Commercial Terms) affects control over the logistics leg.
FOB (Free on Board): The buyer controls the ocean freight. This allows the buyer to select a faster, direct vessel, rather than relying on the supplier’s choice (which is often cost-optimized rather than time-optimized).
CIF/CFR: The supplier controls the freight. Useful for buyers with limited logistics networks, but typically slower.
8. Conclusion
The lead time for Manganese Carbonate is a composite of chemical processing constraints and global logistics dynamics. While a standard manufacturing cycle requires 10–15 days, the total timeline is heavily dictated by the destination and the season of shipment.
For international buyers, the key to mitigating delay risks lies not in demanding faster production—which can compromise chemical stability and quality—but in accurate forecasting and understanding the logistics variables. By buffering timelines with the data provided above (e.g., accounting for the 35–65 day total cycle), companies can maintain resilient supply chains.
FAQ
Q1: What is the standard ex-factory lead time for Manganese Carbonate?
A: Under normal operating conditions, the ex-factory lead time is 10 to 15 days. This includes raw material sourcing, chemical synthesis, flash drying (the critical bottleneck), quality assurance testing, and final packaging. Customized specifications or packaging may extend this timeframe.
Q2: How long does ocean freight take from China to major global ports?
A: Ocean transit times vary by destination and carrier schedule. Typically, port-to-port transit is 16–22 days to the US West Coast, 30–45 days to Northern Europe, and 4–10 days to Southeast Asia. These estimates do not include inland transport or customs clearance.
Q3: How does the Chinese New Year affect Manganese Carbonate orders?
A: Chinese New Year creates a significant disruption. While the public holiday is one week, industrial production and logistics typically slow down or halt for 3 to 4 weeks (Late Jan to Mid Feb). It is recommended to place Q1 orders by early December to avoid delays.
Q4: Can providing a consumption forecast reduce my lead time?
A: Yes. By sharing a rolling forecast (e.g., quarterly requirements), manufacturers can prepare raw materials and reserve production slots in advance. This can potentially reduce the production phase from 14 days to roughly 5 days for standard grades.
Q5: What is the difference between buying FOB and CIF regarding lead time?
A: With FOB (Free on Board), the buyer selects the freight forwarder, allowing for better control over choosing a direct, faster vessel. With CIF (Cost, Insurance, Freight), the supplier often chooses the most cost-effective shipping line, which may involve transshipments and longer transit times.

I am Edward lee, founder of manganesesupply( btlnewmaterial) , with more than 15 years experience in manganese products R&D and international sales, I helped more than 50+ corporates and am devoted to providing solutions to clients business.